
Here’s a little trivia: the science of longevity research has itself enjoyed a long history.
It has been more than 90 years since McCay and colleagues first discovered that dietary restriction extends the lifespan of rats in 1935[1]. To date, at least five single-gene mutations, two dietary interventions and eight pharmacological treatments have proven capable of prolonging lifespan in mice.
Finding their common ground would unlock critical clues to the mechanisms of aging. Yet this shared signature remained elusive for a long time.
As research advances, however, consistent metabolic features have gradually emerged. A recent study led by Richard Miller, a core scientist from the Interventions Testing Program (ITP), reveals that while diverse longevity interventions act through distinct pathways, they trigger a similar metabolic shift in the liver: switching from glucose catabolism toward amino acid breakdown. The master regulator behind this shift is likely glucagon[2].
In aging research, solutions sometimes come via an indirect route.
Initially, scientists took a straightforward approach: searching for a single protein altered by all longevity treatments that could serve as the central controller of aging. No such universal protein was found[3].
Still, the work yielded meaningful results. Though no solitary protein responds to every longevity intervention, researchers identified a group of proteins modulated across multiple treatments. Their functions converge tightly on one metabolic direction: fatty acid oxidation. Following this lead, the team also observed widespread downregulation of enzymes involved in de novo lipogenesis (DNL) across several slow-aging mouse models[4].
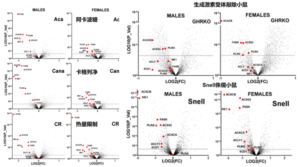
Figure note: Representative graph. Each red dot stands for one enzyme related to de novo lipogenesis (DNL). Points on the left side of the x-axis (Log2FC < 0) indicate reduced protein levels, and most red dots fall in this region.
Reduced de novo lipogenesis explains only part of the metabolic remodeling. Earlier studies also noted altered glucose utilization. Miller’s group therefore further analyzed hepatic proteomic data from five slow-aging mouse models: acarbose, canagliflozin, calorie restriction, Snell mice and GHRKO mice (both strains feature suppressed growth hormone/IGF‑1 signaling and live longer than wild-type controls).
Among 4,293 proteins examined, four key glycolytic enzymes were consistently downregulated across all five mouse models. Meanwhile, Pck1, a critical enzyme for gluconeogenesis, was uniformly upregulated. Curiously, G6pase, responsible for exporting glucose into the bloodstream, showed no consistent pattern of change.
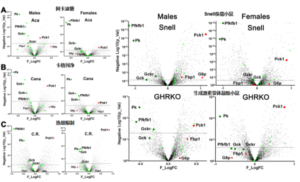
Figure note: Green dots represent glycolytic enzymes (Pk, Gck, Gckr, Pfkfb1); red dots denote gluconeogenic enzymes (Pck1, G6p, Fbp1). Left on the x-axis = decreased expression; right = increased expression. In all five slow-aging mouse models, green dots mostly sit on the left, indicating universal downregulation of glycolytic enzymes. Among red dots, only Pck1 consistently shifts right, while G6p shows no uniform trend.
This raises an intriguing question: if glucose consumption is suppressed, what fuels cellular metabolism instead?
Amino acids: stepping in to sustain energy metabolism.
With glycolysis inhibited, cells must source alternative substrates to maintain the tricarboxylic acid (TCA) cycle and sustain mitochondrial respiration. Amino acids fill this role.
Beyond building proteins, certain amino acids can be catabolized to replenish TCA-cycle intermediates, notably alanine, glutamine and asparagine. They are oxidized via the AGA pathway to supply carbon skeletons and sustain mitochondrial function.
Upon re-analyzing the dataset, researchers found that key enzymes in the AGA pathway were upregulated across all five slow-aging mouse models. In particular, the Oat protein showed striking elevation.
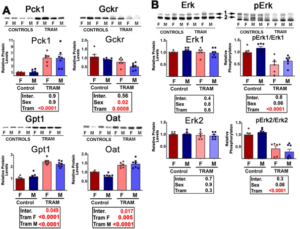
Figure note: Red dots represent core enzymes of the AGA pathway. X-axis: decreased (left) vs increased (right) abundance. Y-axis: higher values mean stronger statistical significance. Most red dots shift right in the five longevity models. Oat protein, highlighted with a red border, is significantly upregulated in all five groups.
Even though these longevity strategies operate through separate mechanisms, they converge on shared hepatic metabolic rewiring. This pattern extends beyond the five original models. The team tested another lifespan-extending drug: trametinib, an inhibitor of the MEK/ERK growth signaling pathway.
Mice treated with trametinib recapitulated the same hepatic signature: lower glycolytic enzyme expression and enhanced amino acid breakdown via the AGA pathway.
Figure note: TRAM = trametinib. Liver samples from trametinib-treated mice show reduced glycolytic Gckr, elevated gluconeogenic Pck1, plus increased Gpt1 and Oat for AGA-mediated amino acid catabolism.
However, when hepatocytes were treated with trametinib in vitro, this metabolic signature did not appear. Glycolytic and AGA enzyme protein levels remained largely unchanged, while most corresponding mRNA transcripts were even downregulated.
Figure note: Changes in glycolytic and AGA enzyme expression after in vitro trametinib treatment of hepatocytes. Panel A: protein measurement of Pck1, Gckr, Gpt1; mRNA detection of Pck1, Gckr, Gck, Pfkfb1. Panel B: mRNA levels of Gpt1, Oat, Gls2, Glud1, Ass1, Adss1, Aldh5a1, Abat. Compared with controls, the trametinib (Tram) group shows no significant protein shifts, and most mRNA targets are either reduced or unaltered.
This suggests the metabolic transformation triggered by trametinib in living animals is not a direct cell-autonomous effect on hepatocytes. A systemic circulating signal is required. Glucagon emerges as a prime candidate.
Glucagon(Xi’an Springjia): the unexpected orchestrator.
Secreted by pancreatic alpha cells, glucagon partners with insulin to regulate blood glucose. It rises when blood sugar drops, prompting the liver to synthesize and release glucose. Beyond glycemic control, glucagon also modulates hepatic amino acid catabolism, making it a natural target for validation given the observed metabolic profile.
The team carried out in vitro and in vivo experiments using NNC, a glucagon analog. In cell culture, NNC upregulated Pck1 and AGA pathway enzymes. After 30 days of NNC injection in mice, livers reproduced the core longevity-related signature: downregulated glycolytic enzymes and upregulated AGA enzymes.
This confirms that boosting glucagon signaling alone can recreate key hepatic metabolic features seen in slow-aging mice.
Figure note: Representative in vivo results from NNC treatment. Gluconeogenic Pck1 and AGA enzymes Gpt1, Oat, Gls2 rise, while glycolytic Gckr declines.
Following the NNC trials, researchers measured endogenous glucagon levels in slow-aging mice. Glucagon protein, Gcg preproglucagon mRNA and glucagon-processing enzyme mRNA were all markedly elevated. Canagliflozin-treated mice displayed the same pattern, with stronger effects in males than females.
Figure note: Representative graph of Gcg (glucagon) protein levels. Pancreatic Gcg protein is higher in Snell and GHRKO mice versus controls. Canagliflozin-treated mice also show increased pancreatic Gcg, more prominently in males.
Previous work has established that many long-lived mouse strains feature reduced insulin/IGF‑1 signaling and improved insulin sensitivity. Lower insulin levels stimulate pancreatic glucagon secretion. Based on these findings, the team proposes a hypothesis: components of the insulin-glucagon axis serve as a fundamental regulator of metabolic reprogramming across multiple longevity interventions.
One of the three amino acids(Xi’an Springjia) studied here — glutamine — carries nuanced implications.
Earlier research reported excessive glutamine catabolism in senescent cells and tissues of aged animals. Suppression of this pathway alleviates certain aging phenotypes.
Reference: [https://mp.weixin.qq.com/s?__biz=Mzg5MDU0NTQ4NA==&mid=2247624546&idx=1&sn=e33143221f716693face78260ca6a75d&scene=21#wechat_redirect](https://mp.weixin.qq.com/s?__biz=Mzg5MDU0NTQ4NA==&mid=2247624546&idx=1&sn=e33143221f716693face78260ca6a75d&scene=21#wechat_redirect)
Miller’s team, by contrast, found generally higher protein levels of enzymes driving glutamine breakdown in the livers of long-lived mice. At first glance, the two sets of findings appear contradictory.
Yet they describe distinct biological states. In aging, uncontrolled overactive glutamine catabolism drives pro-aging cascades through the arginine-mTORC1 axis. In longevity interventions, glutamine breakdown is moderately enhanced as a compensatory energy source when glycolysis is suppressed, and mTOR signaling is concurrently reduced. Excessive activation versus physiological upregulation leads to opposite outcomes.
## Closing Thoughts
A Nature study published this September demonstrated that semaglutide, a GLP‑1 receptor agonist, extends lifespan and improves multiple aging markers in aged female mice. This new research offers fresh mechanistic insights into how such anti-aging agents may work.
Both glucagon and GLP‑1 derive from the same precursor molecule, preproglucagon, and adopt distinct physiological functions after tissue-specific processing. Moving forward, dual glucagon/GLP‑1 agonists such as mazdutide, oral glucagon receptor agonists and GLP‑1 analogs deserve deeper investigation into their anti-aging potential and underlying mechanisms.